I received quite a few responses from my post last week, especially the comment about the number of all time highs and lows to be found within the top 500. This is a simple scan I conduct a few times a month and it does provide a different look at the market.
Therefore, I have decided to do it again for you. This week the scoreline is 29/3. 29 stocks have achieved an all time high in the last week and 3 have set new lows. Just like last week, this would indicate that it is stocks 21 – 200 that are keeping the index near its own 12 month highs.
This tells me that despite the index doing next to nothing this week, the market is moving well.
ASX200
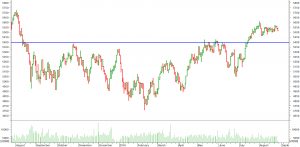
Most of the top 20 stocks on the ASX are not faring so well presently yet the index has moved well over the last few months. This again may indicate the market is reasonably healthy presently even if the banks and some of the other top 20 stocks are not enjoying similar fortunes.
One of the current key levels is 5400 (shown below) and this is likely to provide some support should the index ease a little.
Image from MetaStock
AUD/USD
The Australian dollar is currently in an interesting stage. After it broke higher from the ascending triangle, it enjoyed some support from the key 0.7650 level and many were questioning why the AUD/USD was as high as it was, given the RBA’s outlook.
I also mentioned that if you go back a bit further you will see the 2016 high for the AUD/USD around 0.7835 and this level will likely play a role should the Australian dollar be able to continue its push higher. At this stage, you would expect it to struggle lower than that around 0.7750 before troubling anyone at higher levels.
As I type this it is trading around 0.7640 just below the key level shown on the chart below.
Articles
