
First my apologies for not sending you a market update last week. I was in Jakarta conducting some presentations for Indonesia’s largest FX broker and spent Friday afternoon and night flying home.
I have also just returned home today from presenting for the ATAA in Perth last night – I always enjoy speaking over there and am grateful for being so warmly welcomed.
Last night I opened up and shared with the group some of the data / calculations I use for scanning and pressed home the importance of having data driven decisions in your trading.
Execution Gap
I also spoke last night about something I call an ‘execution gap’. This is the gap between your actual trading results and the optimum performance from your trading plan. In other words, the performance or profit that your trading plan was capable of achieving. With the vast majority of traders, there is always a gap.
Here is the most important point – every trader identifies that there is a gap and to their credit tries to rectify it. However they end up looking in the wrong place to fix it. The gap always comes down to an inability to execute – hence the execution gap. Therefore the problem is internal and requires work on yourself – your patience, confidence in the process and of course, your discipline.
Anyway, just something to keep in the back of your mind. Onto the markets …
AUD/USD
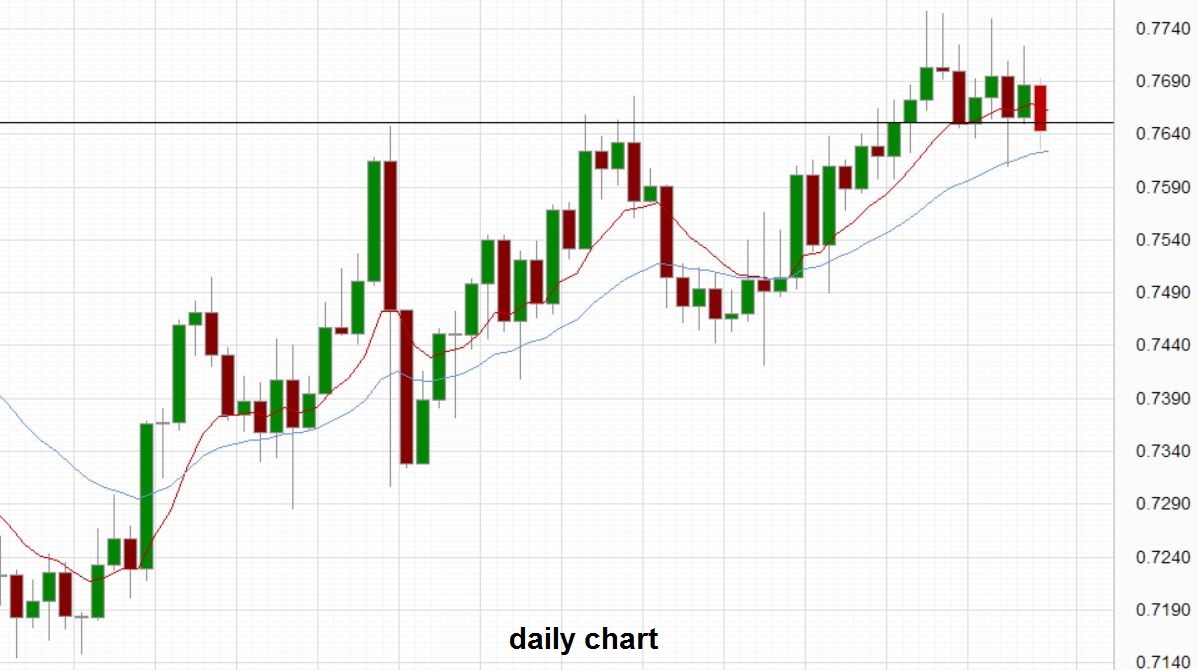
When I spoke in Jakarta last week I was looking at the daily chart of the AUD/USD and pointing out the ascending triangle that had been forming over the last few months with the top around 0.7650. Almost on cue, the AUD/USD broke up through the top of that range as I was speaking and as expected, that level has shown some support in the time since.
If you go back a bit further you will see the 2016 high for the AUD/USD around 0.7835 and this level will likely play a role should the Australian dollar be able to continue its push higher.
ASX200
As I was presenting for the ATAA last night in Perth, I showed the index with the advance decline line plotted. This showed something interesting.
Most of the top 20 stocks on the ASX are not faring so well presently yet the index has moved well over the last few months. This would indicate that it is stocks 21 – 200 that are pushing the index higher and not the top 20. The A/D line confirmed this.
I also conducted a scan and found that within the All Ordinaries Index, 32 stocks have achieved an all time high in the last week but only 1 stock has achieved an all time low. Can you believe that? 32!
This again may indicate the market is reasonably healthy presently even if the banks and some of the other top 20 stocks are not enjoying similar fortunes.

Image from MetaStock
Articles
