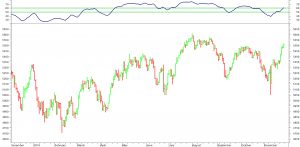
For the week beginning 28 November 2016, my very own Stuart McPhee Market Sentiment Indicator for the S&P/ASX 200 Index (XJO) has returned to near 60 as the ASX200 index has been able to rally to above the key level of 5400. See below for notes on the indicator.
Click on the image below for a larger, clearer image of the S&P/ASX 200 Index.

Image from and calculations performed in MetaStock
Notes:
My very own Stuart McPhee Market Sentiment Indicator provides a general summary of how bullish or bearish the market is by providing a value between 0 and 100. This can provide you guidance on how committed you should be to stocks and therefore how much money you would consider committing from your entire portfolio to stocks alone. It could also provide some indication of your bias between long and short positions in your ASX portfolio.
For example, if the indicator is reading neutral, you may only consider taking partial positions in stocks you purchase. If the indicator was reading bullish, you may not impose any restrictions on your trades and conversely, if the indicator was reading bearish, you may be more selective with which trades you take, or be more open to taking more short trades.
The Indicator can be interpreted as follows:
Below 50 is bearish
Between 50 and 60 is neutral
Above 60 is bullish
Naturally, a reading well below 50 is to be considered very bearish. Likewise, a reading well above 60 is to be considered very bullish.
